We're expanding Journey Management charts to help business analysts move beyond simple event counts and unlock deeper performance insights directly within Genesys Cloud.
What's coming?
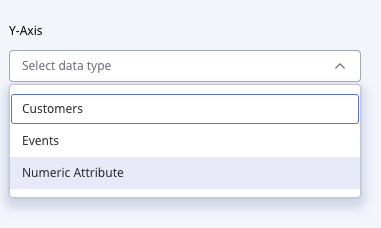
- Create charts using numeric attributes from journey events
- Visualize metrics like durations, turn counts, query counts, confidence scores
- Apply calculations such as Average, Sum, Minimum, and Maximum
- Analyze trends over time with line, bar, and column charts
- Compare numeric metrics across journey dimensions like media type, intents, and more
Why this matters for AI-powered journeys
As organizations increasingly adopt bots and virtual agents, understanding how AI experiences perform becomes just as important as tracking traditional journey metrics. Numeric charts will help teams analyze AI-driven signals such as:
- Bot confidence trends
- Customer effort indicators (turn count, query count)
- Interaction durations.. and more!
This enhancement helps teams understand how well both human and AI-assisted journeys perform - all within Journey Management.
Stay tuned for more previews and examples as we get closer to release!
Target GA date: June 22, 2026
------------------------------
Harshali Desai
Principal Product manager, Journey Management
------------------------------