Genesys Cloud - Main

 View Only

Sign Up

  Thread closed by the administrator, not accepting new replies.
  • 1.  Queue performance metrics - more then 100%

    Posted 04-23-2025 12:01
    No replies, thread closed.

    Hello

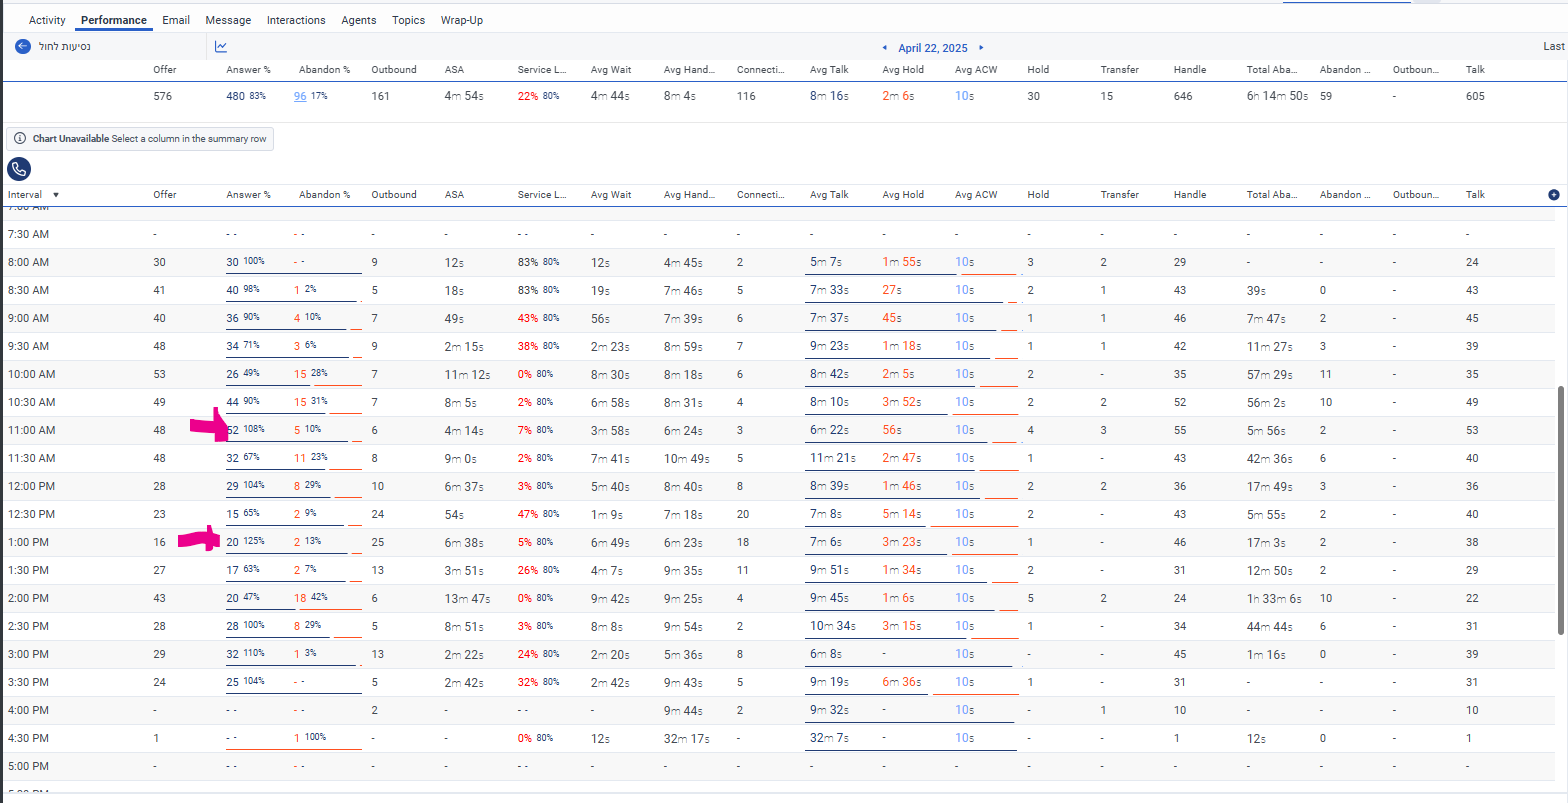
    We have the problem with the Queue performance repot. In more than one interval we get more than 100% answerd calls (see the attched screen)

    How this metrics calcilated?

    Thank you in advance


    #Metrics
    #PerformanceViews

    ------------------------------
    Anna Mazor
    CEO
    ------------------------------


  • 2.  RE: Queue performance metrics - more then 100%
    Best Answer

    Posted 04-23-2025 12:11
    No replies, thread closed.

    Hi Anna,

    It looks like the interactions were offered in an interval and then not answered until the following interval, so the percentage answered vs offered is more.


    Why does the Offered metric not always equal the Answered plus Abandoned metrics?


    ------------------------------
    Sam Jillard
    Online Community Manager/Moderator
    Genesys - Employees
    ------------------------------


  • 3.  RE: Queue performance metrics - more then 100%

    Posted 04-23-2025 13:20
    No replies, thread closed.

    Thak you for your answer.

    Is there any way to get METRICS by intervals?

    Our client is migrating from Avaya to Genesys Cloud. A key requirement for their call center managers is the ability to access reports displaying interval-based data, including metrics such as abandonment percentage


    ------------------------------
    Anna Mazor
    CEO
    ------------------------------


  • 4.  RE: Queue performance metrics - more then 100%

    Posted 04-24-2025 04:25
    No replies, thread closed.

    Hi Anna, That is interval based, but based on when the event happened.

    Looking at the Avaya documentation, the equivalent report does the same thing, so I am not sure what your client is trying to achieve.


    ------------------------------
    Sam Jillard
    Online Community Manager/Moderator
    Genesys - Employees
    ------------------------------


  • 5.  RE: Queue performance metrics - more then 100%

    Posted 06-25-2025 03:48
    No replies, thread closed.

    I think that the percentages in this view are kinda useless. As you and the docs say, the answered and abandoned interactions metrics of an interval aren't necessarily part of the offered ones.

    Example

    • Scenario:
      • 20 interactions offered in the current interval - all are still waiting in the queue.
      • 40 interactions answered in the current interval - all were offered in the previous interval.
      • 40 interactions abandoned in the current interval - also, all were offered in the previous interval.
    • Metrics:
      • % Answered = 200%
      • % Abandon = 200%

    It does not make sense! It is like comparing apples to oranges. In any meaningful % calculation, the numerator should always be a subset of the denominator.


    ------------------------------
    Adrián Santamaría
    ------------------------------
    -------------------------------------------
    Mensaje original:
    Enviado: 04-23-2025 12:11
    De: Samuel Jillard
    Sujeto: Queue performance metrics - more then 100%

    Hi Anna,

    It looks like the interactions were offered in an interval and then not answered until the following interval, so the percentage answered vs offered is more.


    Why does the Offered metric not always equal the Answered plus Abandoned metrics?


    ------------------------------
    Sam Jillard
    Online Community Manager/Moderator
    Genesys - Employees