Coming Soon: Greater Visibility into Forecast Outliers
We're excited to introduce a new Outliers experience for workforce management forecasting.
Historical anomalies can affect forecast accuracy, and understanding how they are identified and normalized is essential for building confidence in your forecast. With the new Outliers tab, you'll have clearer visibility into unusual historical data before it is used to generate a forecast.
What's New and Why It Matters
The forecasting system automatically identifies unusual historical data points and normalizes them before forecast generation. A value is classified as an outlier only when it is confirmed through detection methods, including:
- Trend
- Seasonality
- Recurring patterns
The new Outliers tab allows you to review:
- Detected outliers
- Original actual values
- Normalized values used for forecasting
- Impacted planning groups
- Affected time periods
- Percentage differences between actual and normalized values
This added visibility helps you better understand how historical anomalies are handled and how they may affect your forecast.
How to Access It
Navigate to: Workforce Management > Forecasting > Main Forecast > Outliers
When outliers exist for the selected planning groups and date range, they appear in the Outlier table. If none are found, the page displays "No outliers detected".
The table includes the following information:
- Week: The week containing the outlier
- Planning Group: The affected planning group
- Actuals: The original historical value
- Normalized: The adjusted value used for forecasting
- % Difference: The difference between the actual and normalized values
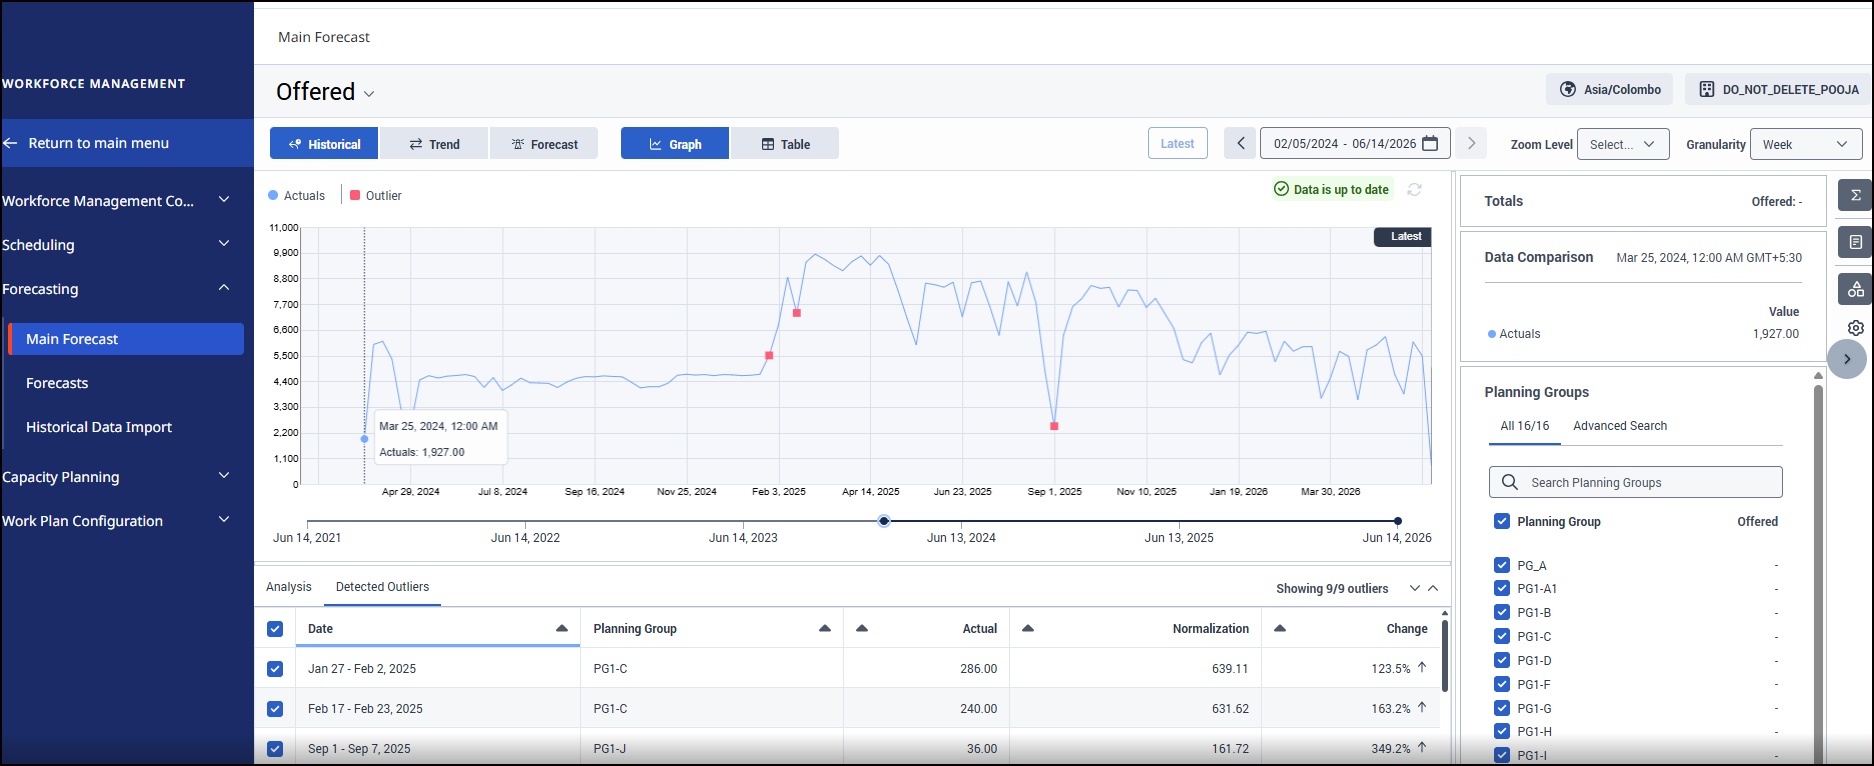
- You can select individual outliers, select multiple outliers, select all outliers, or clear all selections. Only selected outliers appear on the graph and in the table.
-
When you add or remove planning groups, the Outlier table refreshes automatically.
- Outliers you already selected remain selected.
- When you add a planning group, its outliers are selected automatically only if Select All is enabled.
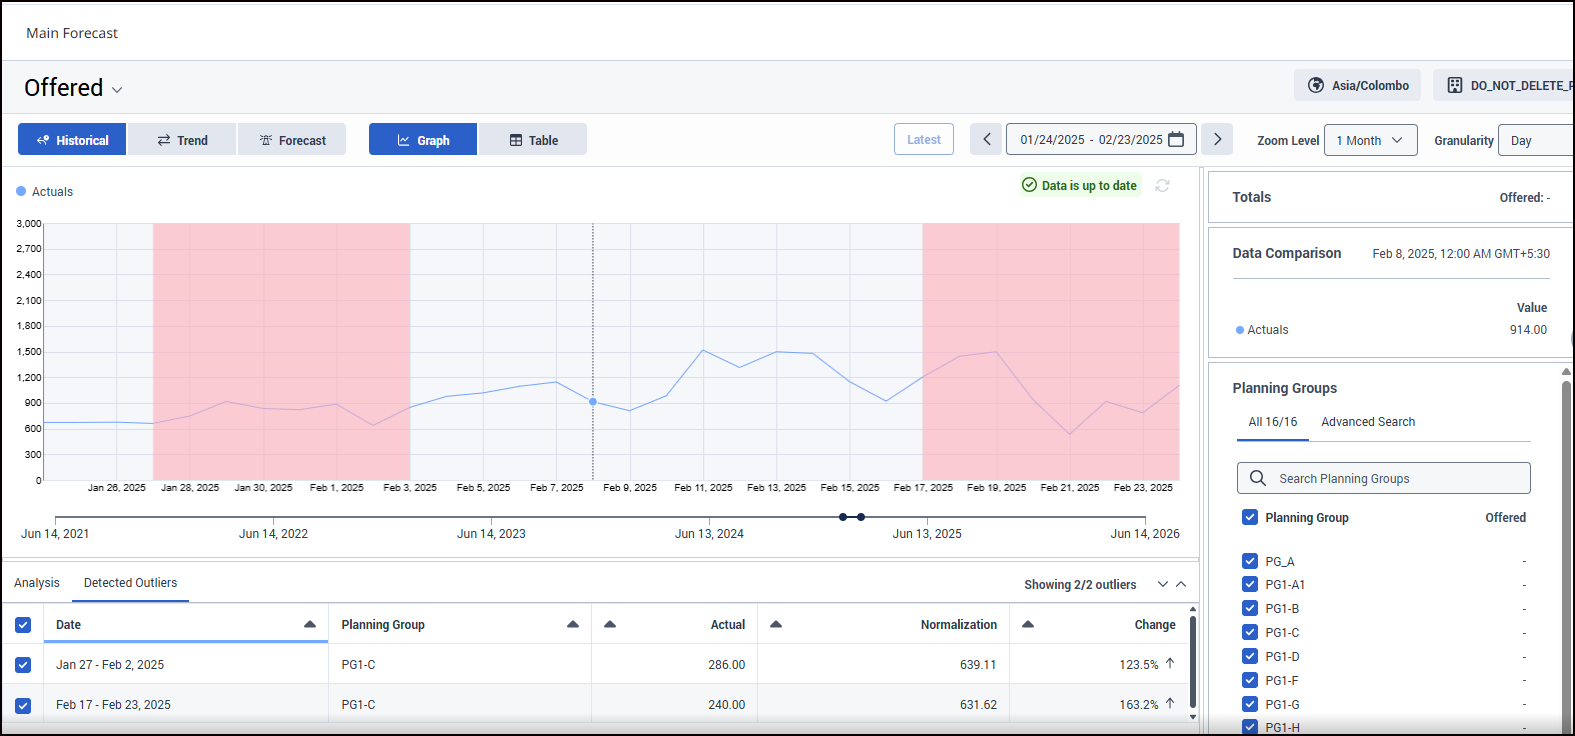
In the graph:
- Outliers at weekly granularity appear as square markers.
- At all other lower granularity outliers appear as shaded bands covering the affected week.
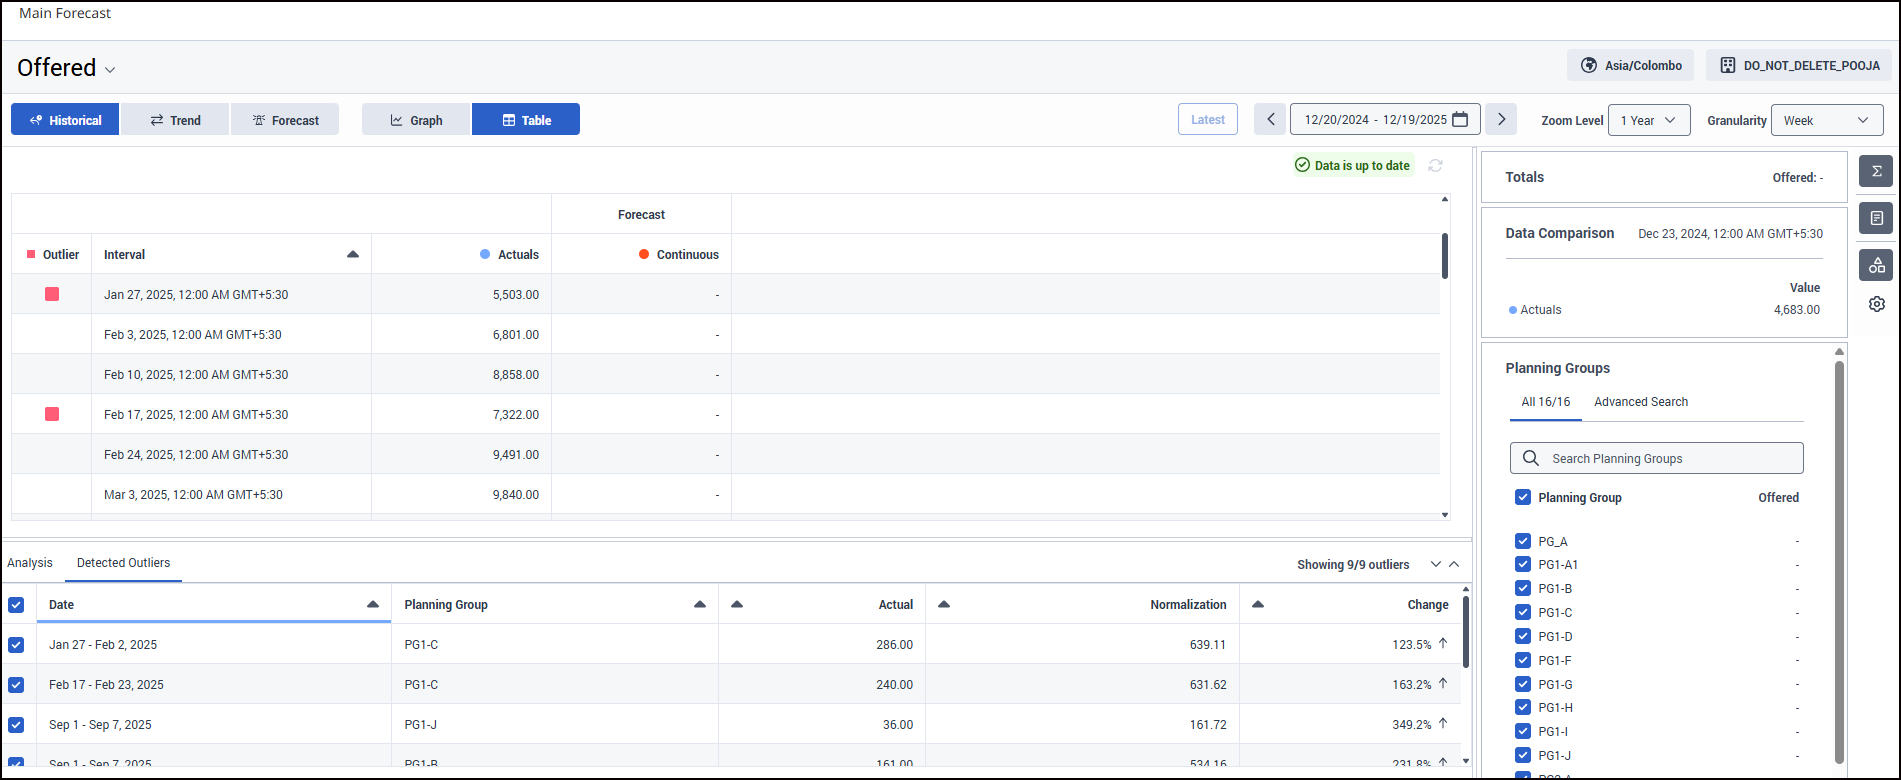
The Main Forecast table also includes an Outlier indicator for all periods associated with an outlier week.
Important Considerations
- Outliers are detected and stored at the weekly level.
- Normalized values are available only at the weekly level.
- Outliers cannot be edited.
- Outliers are not available in the Legacy Forecast UI.
- Users must have the Main Forecast > View permission to review outlier information.
Explore the new Outliers tab to better understand how historical anomalies are identified and normalized, and share your feedback with us in the community.
#Forecasting
------------------------------
Pavithra Asokan
Staff Product Manager, WEM
------------------------------