Genesys Cloud - Main

 View Only

Sign Up

  • 1.  Variance in figures in 'Queue Performance' and in total interactions when exported

    Posted 14 days ago

    Hi all,

    We have recently gone through a Genesys uplift and as part of this are redesigning our call stats.  Traditionally somebody copied the total calls from the queue performance page to a separate spreadsheet however now we are pulling a report of all interactions which is being fed into powerBI. 

    The issue we are facing is the figures are slightly different.  On a queue that has roughly 350 calls, it is often out by ~10 calls.  I have tried pulling the raw data and applying all kinds of filters (inbound, outbound, abandoned, callbacks etc etc) to try and get the figures to match with no luck.  I know other genesys users have reported where interactions are started one day and finalised another that it can skew the figures however we have tried manually removing the 1 or 2 callbacks that were left overnight which still does not fix our numbers.  We do not have emails or messages etc on this queue it is purely inbound, outbound and callbacks.  

    Does anyone have any idea why these two figures would be different or have guidance on what filters should be applied to make sure our numbers match in the genesys report to what is being exported to powerBI?  I know the business will not be happy if we cannot justify why the two figures are different (and its also breaking my brain and I want to understand it!).  

    Thanks.


    #Reporting/Analytics

    ------------------------------
    Robert Brown
    Member Advocate
    ------------------------------


  • 2.  RE: Variance in figures in 'Queue Performance' and in total interactions when exported
    Best Answer

    Posted 13 days ago

    Hi Robert,

    From my understanding, queue transfers, flow-outs (callbacks, voicemail, transfers, etc.), and metric timestamp attribution can sometimes result in differences between Queue Performance metrics and interaction exports. Queue Performance metrics are also interval-based, which may lead to differences when compared with conversation detail exports.

    I noticed you've already accounted for the overnight callbacks, so I'd be interested to hear if anyone from the community has encountered something similar and how they reconciled the figures.


    ------------------------------
    Phaneendra
    Technical Solutions Consultant
    ------------------------------


  • 3.  RE: Variance in figures in 'Queue Performance' and in total interactions when exported

    Posted 13 days ago
    Edited by Marcello Jabur 13 days ago

    Hey Robert, if you could give more details and examples (Which metrics exactly are not matching, etc.), maybe someone will be able to see something that you are not seeing.

    Also, have you tried investigating by just looking at a smaller sample? Looking at the whole day (350 interactions, assuming that's the number for the whole day) might be a little hard to see which interactions are not matching, etc. But if you try to check for just 1 hour, or maybe a 30 minutes interval, the difference might only be for 1 or 2 interactions, and then you can check 1 by 1 to try to identify which interaction is missing on the source that has a lower number, etc.

    Edit: Also, something else to keep in mind.. Are both sources using the same timezone? Make sure that the data exported is using the same one you use on the Genesys interface, otherwise you could see some interactions being counted towards the wrong day without noticing, etc.


    ------------------------------
    Marcello Jabur
    ------------------------------


  • 4.  RE: Variance in figures in 'Queue Performance' and in total interactions when exported

    Posted 13 days ago

    Thanks for the responses.  To clarify I am comparing figures from 'Queue Performance' in the analytics workspace.  

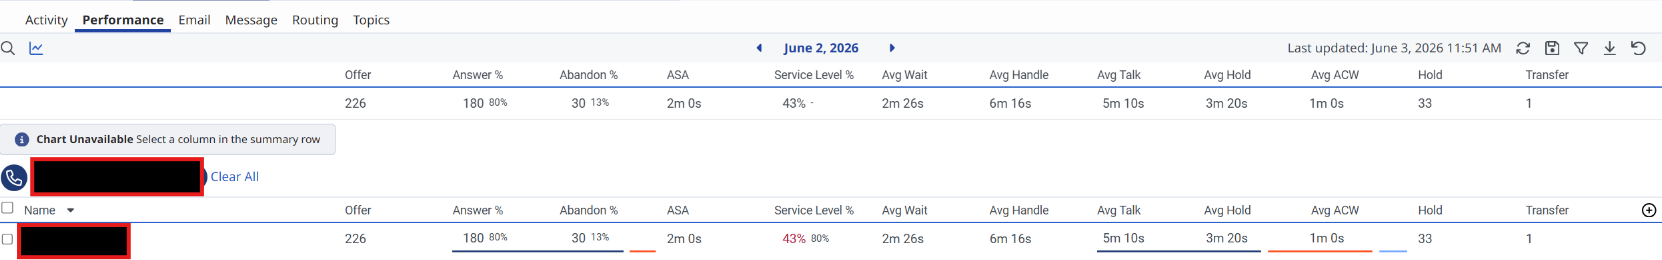
    Then if I click through to see the individual interactions by clicking on queue name>Interactions then export to excel I get a total of 363 interactions.  If I then filter the raw data to remove outbound (as we do have agents calling out from this queue) I get 235.   If I remove callbacks, which reflect as inbound/outbound, I get 209.  

    I am struggling to get my export of calls to match the total. I even got copilot to run over the data and asked it to apply different filters to find a combination that would match the 226 and it couldnt. I can try drilling down to different timeframes to see if it can help pinpoint where the issue may be but curious if anyone else has any ideas.  


    Thanks again for any insights.  


    ------------------------------
    Robert Brown
    Member Advocate
    ------------------------------


  • 5.  RE: Variance in figures in 'Queue Performance' and in total interactions when exported

    Posted 13 days ago

    Thanks for the additional detail, Robert.

    I think drilling down to a smaller timeframe is a good idea. If you can narrow the variance down to just a few interactions, it may be easier to identify exactly what is being counted differently between Queue Performance and the interaction export.


    ------------------------------
    Phaneendra
    Technical Solutions Consultant
    ------------------------------


  • 6.  RE: Variance in figures in 'Queue Performance' and in total interactions when exported

    Posted 13 days ago

    I will try to check later on my own reportings if I can find something similar,

    But I just wanted to also mention some things for you to consider:

    1) You mentioned removing callbacks as they are reflect as "inbound/outbound". I don't think you should remove them, as callbacks are originally an inbound call that just transforms into a callback.

    2) Something else to check, maybe some of your interactions are being routed back to the queue, and this might cause the "Offer" metric to count it twice? (I haven't checked, but maybe take a look at this)... So if that's the case you could simply have some interactions counting twice, so that's why the number of Offer is higher than the total number of interactions that you see on your export.


    ------------------------------
    Marcello Jabur
    ------------------------------


  • 7.  RE: Variance in figures in 'Queue Performance' and in total interactions when exported

    Posted 13 days ago

    Hi Robert,

    I have similar observations as well from my Org and is able to come up with below:

    The Queue Performance View will be bifurcated to Voice only or Callbacks only depending on your filter.

    The Interactions View won't, therefore the amount you have in Interactions (without outbound) is the total of Voice+Callbacks.

    From your screenshot, the amount of Voice Offered is 226. Move the filter from Voice to Callbacks then add its Offer to the 226 Voice; It should show the tally similar to what Interactions View has.


    ------------------------------
    Jerold Paris
    ------------------------------