Genesys Cloud - Reporting and Analytics

 View Only

Discussion Thread View
Expand all | Collapse all

Reporting & Analytics Tips and Tricks Contest

  • 1.  Reporting & Analytics Tips and Tricks Contest

    Posted 06-11-2025 07:14
    Edited by Matt Lawson 06-11-2025 12:00

    Hello Everyone,

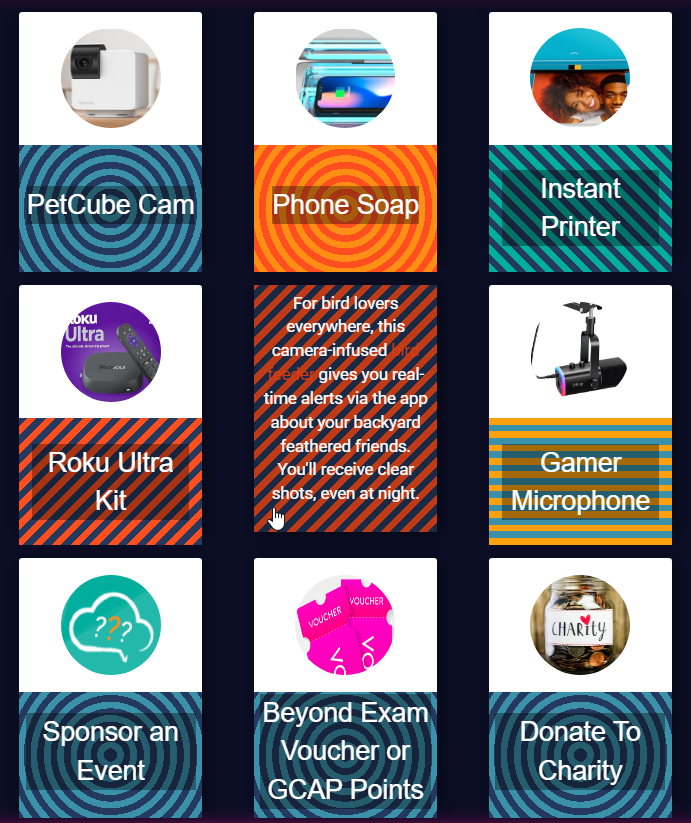
    Who wants to share their knowledge for the chance at a prize from the prize wall?

    The Reporting and Analytics Community is going to host a new tips and tricks series, and who has more hints and tips than you! Have you discovered a workaround, shortcut, neat trick or discovered some hidden functionality that you didn't realise would be so beneficial? Let us know and you could win yourself a prize.

    The only stipulation being that is related to the Reporting & Analytics functions (Performance Views/Exports, Dashboard & Alerts).   

    How to Enter – Reply to this thread - Make sure to explain the hint/tip/trick and how it benefited you.  Submissions will be reviewed by the Community team and judged based on originality, benefit, and appeal.   You can add images/videos to help explain your submission, but please make sure no PII (personally identifying information) is included, like full names, email, etc., or the submission may be removed and need to be resent.

    When - The contest is open from 6/11/2025 and submissions needs to be entered by 7/4/2025 and a winner will be picked and announced on the following week

    Prize – The judges' favorite submission will get their pick from the Prize wall
     

    GCAP Points - Want some GCAP points? Here's some math for you! You can also earn points for the following:

    • 10 points for entering

    • 25 points for honorable mentions 

    • 50 points for the runner up 

    • 100 points for the winner

    Looking forward to hearing your time-saving secrets, and seeing if mine is mentioned by anyone else!


    #Unsure/Other

    ------------------------------
    Sam Jillard
    Online Community Manager/Moderator
    Genesys - Employees
    ------------------------------


  • 2.  RE: Reporting & Analytics Tips and Tricks Contest

    Posted 06-11-2025 12:41
    Edited by Shelby Cronk 06-11-2025 12:45

    I am constantly being asked how to "pull a report for several queues or agents, for an extended duration, at 30-minute intervals." Here is the solution: 

    1. Open the Queue/Agent Performance View
    2. Filter to all Queues/Agents you want to report on (even if that is "all of them").
    3. Use the "View as Group" option
    4. Set your date/date range at the top of the view; max 30 days for this to work. 
    5. When exporting...
      1. set your granularity to 30 minutes
      2. Expand Formatting; check the box for "split filters." 
    6. Click Export.


    ------------------------------
    Shelby Cronk
    ------------------------------


  • 3.  RE: Reporting & Analytics Tips and Tricks Contest

    Posted 06-11-2025 13:59

    These are great, Shelby! Thanks for being the first submission...or 4!!!!


    ------------------------------
    Matt Lawson
    Genesys - Employees
    Online Community Manager
    ------------------------------


  • 4.  RE: Reporting & Analytics Tips and Tricks Contest

    Posted 06-11-2025 12:42

    For organizations that only care about Queue-related information, I get asked often how to "only see queue-data in Agent view": 

    1. Open Agent Performance View; apply appropriate filters
    2. Use Toggle Filters panel in top right; scroll all the way to the bottom and UNcheck the "No" box under ACD


    ------------------------------
    Shelby Cronk
    ------------------------------


  • 5.  RE: Reporting & Analytics Tips and Tricks Contest

    Posted 28 days ago

    Hey Shelby. Thanks for the great tips!

    By unchecking ACD, are you just removing outbound calls initiated on behalf of the agent rather than the queue? 


    ------------------------------
    Andrea Rushfeldt
    Resource Enablement Advisor
    ------------------------------


  • 6.  RE: Reporting & Analytics Tips and Tricks Contest

    Posted 27 days ago

    @Andrea Rushfeldt - I may be wrong. But, I would assume this will remove all Non-ACD calls from the view. For example agents direct dialing another agent. 


    ------------------------------
    Michael Rigney
    Sr. Contact Center Engineer
    ------------------------------


  • 7.  RE: Reporting & Analytics Tips and Tricks Contest

    Posted 27 days ago

    Correct! When you uncheck "no" on ACD, you will continue to see interactions dialed on behalf of queue; also worth mentioning that when you are looking at an Agent Performance View: Answer and Outbound are both queue-related metrics.  Non-queue-related conversations are only included in the Handle number.


    ------------------------------
    Shelby Cronk
    ------------------------------


  • 8.  RE: Reporting & Analytics Tips and Tricks Contest

    Posted 06-11-2025 12:44

    Anytime your brain says "can I see just or can I see only" you'll usually find your solution in the top, right Toggle Filters panel.  Anytime your brain says "can I see..." and it is followed by a number (time of, average of, number of), it is usually a column. 


    ------------------------------
    Shelby Cronk
    ------------------------------


  • 9.  RE: Reporting & Analytics Tips and Tricks Contest

    Posted 06-11-2025 12:45

    For organization using shared physical phones and/or organizations that struggle with call avoidance, you can track whether an agent has a phone selected by adding the station column to:

    • Queue Activity Detail View
    • Agent Performance View
    • Agent Status View


    ------------------------------
    Shelby Cronk
    ------------------------------


  • 10.  RE: Reporting & Analytics Tips and Tricks Contest

    Posted 06-11-2025 16:00

    Data actions performance is great to understand how people are navigating within the IVR as it interacts with external systems and where potentail brakdowns may occur.


    ------------------------------
    Bob Hall
    .
    ------------------------------


  • 11.  RE: Reporting & Analytics Tips and Tricks Contest

    Posted 06-11-2025 16:22

    We are quite new to Genesys cloud, and I am looking forward see all the tips and tricks that everyone will be sharing so i can learn from it. 

    There is this one trick that is making our workforce planning team and frontline leaders' life so much easier when it comes to agent performance or agent status reporting. 

    and that is "Using the filter" option. If you have got a request to run agent performance or status report for any particular team whether it's for just team manager or multiple leaders:

    1. Open the Agent performance/ agent status report
    2. Use the filter and search of the reporting leader name and it will show that person's name twice one as a user, another as "Reports to"
    3. Click on 2nd row where it shows leader's name as "reports to"
    4. you will have a filtered report for all the agents that are reporting to that team leader only. 
    5. This saves so much time as you don't need to select agent's name one by one to make sure you are running the report for one particular team only. 


    ------------------------------
    Navjot Kaur
    Lead workforce planner
    ------------------------------


  • 12.  RE: Reporting & Analytics Tips and Tricks Contest

    Posted 28 days ago

    Navjot - this is interesting, we get to the same result by adding people to groups and naming the groups by leader.  I like you way better, does a reporting tree or Organizational Chart need to be set up within Genesys to accomplish this?    I usually do not get data for an individual when I select the name listed with "Reports to." that's why I am asking.


    ------------------------------
    Judy Jimenez, Call Center Operations Manager
    CURE Auto Insurance
    ------------------------------


  • 13.  RE: Reporting & Analytics Tips and Tricks Contest

    Posted 27 days ago

    @Judith Jimenez - The "Report To" is based off of the "Management' field of the "Relationships" section in the user's profile. You would need to add the "Relationships" widget to your user profiles and then add managers for each user. Then when you search for the manager name in your perfomance view filter, you will get the list of agents that "report to" the manager(s) selected.


    ------------------------------
    Michael Rigney
    Sr. Contact Center Engineer
    ------------------------------


  • 14.  RE: Reporting & Analytics Tips and Tricks Contest

    Posted 15 days ago

    That's right! @Judith Jimenez   whenever a new starter joins the organisation, our service desk team creates their profiles along with the reporting manager name in the active directory, which means Genesys profiles picks up all the details about the new hire. but when it comes to team movements within the organisation then I just manually update their profile details in Genesys cloud and update the new manager's name under the Relationships widget - Management section. Which Michael Rigney explained in his response :-)


    ------------------------------
    Navjot Kaur
    Lead workforce planner
    ------------------------------


  • 15.  RE: Reporting & Analytics Tips and Tricks Contest

    Posted 06-12-2025 22:46

    Flow Destination Report provides a valuable overview by showing how many customers entered each sub-queue and how many calls exited the IVR to external numbers (faults team) in our case. It's one single view which provides the high-level information. 


    ------------------------------
    Romi Agrawal
    Manager - Customer Experience
    ------------------------------


  • 16.  RE: Reporting & Analytics Tips and Tricks Contest

    Posted 06-13-2025 08:30
    Edited by Ekaterina Kononova 06-13-2025 08:31

    In our company we found really useful one hidden feature. Why hidden? we found it by experiment and not from training or from knowledge sharing from Genesys Professional Services ;) 

    When creating widget in dashboards a user can create a list view of all waiting interactions with the skill. And as you may have experienced skills are much wanted to get included in real-time reports based on Genesys ideas. 

    In our case, it supports RTM teams in the markets with multiple languages. In Switzerland they monitor if there are more calls waiting for italian language, which is less staffed normally than major languages.


    ------------------------------
    Ekaterina (Kate) Kononova
    Product Development | Data, Analytics & Quality Management
    Sweden
    ------------------------------


  • 17.  RE: Reporting & Analytics Tips and Tricks Contest

    Posted 29 days ago

    Our company utilizes agent-requested/optional After Call Work (ACW) for our voice channels. A particularly useful metric in both agent performance and queue performance workspaces is 'ACW'. This metric tracks the number of times an agent enters ACW mode/status. By dividing the number of ACW entries by the number of answered calls, we can determine the agent's ACW entry percentage. This percentage is invaluable for analyzing agents with longer Average Handle Times (AHTs).

    Example:

    • Answered calls: 1000
    • ACW entries: 400
    • ACW entry percentage: 40%


    ------------------------------
    Garrett Gardner
    ------------------------------


  • 18.  RE: Reporting & Analytics Tips and Tricks Contest

    Posted 28 days ago

    It's not something hidden but I seem to walk people through this a lot. Our supervisors and managers look for log in/log out reports often and they get to this point and wonder why things don't always look right.

    I'm always telling them that to see each instance of a log in or out, they need to actually click on the person AND change the View by as "Log in - Log out" to bring up each time someone has logged in and out of the system.


    ------------------------------
    Seean Weaver
    MAPFRE USA - Telecom Analyst
    ------------------------------


  • 19.  RE: Reporting & Analytics Tips and Tricks Contest

    Posted 15 days ago

    Hi Seean,
                    One more tips on the available timing, Below is the screenshot that shows the availability in chart . It is easy to understand

    Thanks,
    Thirumurugan


    ------------------------------
    Thirumurugan Balamurugan
    Senior PS Consultant
    ------------------------------


  • 20.  RE: Reporting & Analytics Tips and Tricks Contest

    Posted 28 days ago

    Hi,

    Most of the tips n tricks have been mentioned already.
    However, I generally recommend supervisors/leads a 'Silent Queue watchdog' technique -
    - Create a Dashboard, that shows Queues with 0 activity in last 'X' minutes.
    Simple trick to spot routing issues or misconfigured/unutilized flows.
    This might help to avoid any major issues later.


    ------------------------------
    Ashiesh Sharma
    GCX- GCP, ARC, SCR, QM
    BT plc
    ------------------------------


  • 21.  RE: Reporting & Analytics Tips and Tricks Contest

    Posted 28 days ago

    Hey Ashiesh. I'm not the best at doing dashboards. How do you set this up?


    ------------------------------
    Seean Weaver
    MAPFRE USA - Telecom Analyst
    ------------------------------


  • 22.  RE: Reporting & Analytics Tips and Tricks Contest

    Posted 27 days ago

    Hi @Seean Weaver,

    You can set the Dashboards under performance > Workspace > Dashboards (search)
    - Create a New Dashboard (name it something like 'Silent Watchdog')
    1. Choose Widget type - 'Metric,' 
    2. Select the Queues you want data for.
    3. Select the Metric(s.) For e.g. Offered, Answered & Abandoned.


    4. Time Period - day/week/month etc
    - Then the kind & Type of view you want. 

    Let me know if it was useful !!!


    ------------------------------
    Ashiesh Sharma
    GCX- GCP, ARC, SCR, QM
    BT plc
    ------------------------------


  • 23.  RE: Reporting & Analytics Tips and Tricks Contest

    Posted 28 days ago

    Hi Ashiesh - Curios to understand - how do you set this up?


    ------------------------------
    suyog gupta
    Principal Management Engineer
    ------------------------------


  • 24.  RE: Reporting & Analytics Tips and Tricks Contest

    Posted 27 days ago

    Hi @suyog gupta,

    I've shared the steps above.
    The Dashboard would look something like this, based on what all metrics you choose.


    ------------------------------
    Ashiesh Sharma
    GCX- GCP, ARC, SCR, QM
    BT plc
    ------------------------------


  • 25.  RE: Reporting & Analytics Tips and Tricks Contest

    Posted 27 days ago

    Hi Everyone,

    Probably time-saving for those who'd like to look back on previous day's performance from their inbound ACD queue.

    Instead of opening the Queue Performance Page, you can create a dashboard with a chart containing the important metrics for the queues like Answer, Offered, Handle, and Over SLAs. This will add a visual aid on how your queues are performing on specific dates.

    Steps:
    1. Navigate to Performance > Workspace > Dashboards

    2. Click on "New Dashboard", enter the name of your dashboard, then click save.

    3. Add Widget > Choose Chart
    Filter By: Queues
    Metrics: Answer, Handle, Offered, Over SLA, etc.
    Time Period: 30 days (or any preferred)
    Options: Display Full Width
    Media Type: Voice (or any preferred)

    4. Click Save

    Note: Navigating your mouse pointer to a specific date will provide the specific metric data of that day.


    ------------------------------
    Jerold Paris
    ------------------------------


  • 26.  RE: Reporting & Analytics Tips and Tricks Contest

    Posted 27 days ago

    Really loving the entries we have had so far and that others in the community are asking for further information on some them, really showing how useful these hints and tips can be.

    Keep them coming :D


    ------------------------------
    Sam Jillard
    Online Community Manager/Moderator
    Genesys - Employees
    ------------------------------


  • 27.  RE: Reporting & Analytics Tips and Tricks Contest

    Posted 27 days ago

    I love reading these tips as a new user in the cloud. 

    I have encountered issues finding reports that I was previously able to pull in Pure Connect. The one tip I've found is to check the Genesys Cloud Product Ideas Lab and search to vote for a project idea that's needed if it's not currently available or add one.

    I would like to pull reports for more than a 30-day period (go vote 😊 )


    ------------------------------
    Stacey Sanchez
    PACU- Workforce Operations MGR
    ------------------------------


  • 28.  RE: Reporting & Analytics Tips and Tricks Contest

    Posted 27 days ago

    We were part of investigation where we need to fetch estimated wait time so that we can publish it in client interface.

    To get the estimated wait time (EWT) in Genesys Cloud, you can use the Play Estimated Wait Time action within an in-queue flow in Architect. Here's a step-by-step guide based on available information:

    • Access Architect:
      • From the Genesys Cloud Admin menu, navigate to Architect.
      • Select Flows > In-Queue Flow (or create a new one).
    • Add the Play Estimated Wait Time Action:
      • Open the desired in-queue flow in the Architect task editor.
      • From the Toolbox, drag the Play Estimated Wait Time action to the appropriate spot in the task sequence.
      • Give the action a descriptive name (or keep the default, e.g., "Position In Queue").
    • Configure the Action:
      • In the Estimated Wait Time (EWT) field, use the default variable Call.EstimatedWaitTime for automatic EWT calculation, or specify a custom value if needed.
      • Choose a Playback Mode:
        • Approximate: Plays a rounded, less specific wait time (e.g., "about five minutes").
        • Less Than: Provides a specific wait time, rounded down.
        • Padded: Plays a range (e.g., "between 3 and 5 minutes"). You can set a Padding Interval to round up in even minutes.
        • Precise: Plays the exact EWT.
      • If using Approximate or Less Than modes, select a Round Up Interval to define how the wait time is rounded (e.g., to the nearest minute).
    • Understand EWT Calculation:
      • Genesys Cloud calculates EWT based on historical data from the previous week (down to the half-hour interval) using metrics like handle time, abandonment rate, and number of interactions offered.
      • It also considers the current queue position and agent availability. If no agents are active, EWT uses the longest waiting interaction in the queue. If no historical data exists, there's no maximum EWT threshold, and default values (e.g., 150 seconds for average handle time) may apply.
    • Using the API (Optional):
      • For programmatic access, use the Genesys Cloud API endpoint /api/v2/routing/queues/{queueId}/mediatypes/{mediaType}/estimatedwaittime (e.g., set mediaType to "call" for voice interactions).
      • This returns the EWT in seconds. Ensure agents are correctly staffed for the media type, as issues like agents prioritizing other interactions (e.g., email over chat) can skew results.
    • Handle Edge Cases:
      • If EWT is null (e.g., no agents or no historical data), configure decision blocks in Architect to check for null values before performing actions based on EWT.
      • For custom scenarios, like converting EWT to seconds, use Architect expressions (e.g., ToInt(Call.EstimatedWaitTime / 1s)) in the flow.
    • Test and Save:
      • Test the flow to ensure the EWT announcement plays correctly for callers.
      • Save and publish the flow.

    Notes:

    • EWT is only available in in-queue flows, not other flow types.


    ------------------------------
    Mahesh Dora
    ------------------------------


  • 29.  RE: Reporting & Analytics Tips and Tricks Contest

    Posted 27 days ago

    Interaction View for determining how long an agent may be "sitting on a callback".

    • View: Interactions
    • Filter > Media Type: Callback
    • Pick Columns:
      • Media Type
      • Users – Interacted
      • Total Handle
      • Active Total Callback

    Subtract Active Total Callback from Total Handle to give you the combined time listening to voicemail / spent sitting on a callback (before and/or after the call itself). Interactions with significant differences may warrant investigation. 


    ------------------------------
    Iann Dunavent
    Digital Communications Specialist
    ------------------------------


  • 30.  RE: Reporting & Analytics Tips and Tricks Contest

    Posted 27 days ago
    Edited by Nicki Dehn 27 days ago

    I am frequently asked about the Queue Performance View and the Agent Performance View: (1) Viewing just my team and (2) Why the Answered and Abandon calls do not total Offered

    • Queue Performance: I have a job aid explaining a few items as well as adding the Flow Out column since the total number of flow-outs, answered, and abandoned = offered
         a. I am not sure why Flow-out is not a static default display field to a void confusion over Offered

    • Agent Performance View: I also advised to use their name and select "Reports To" to display their direct reports without having to add them individually.

    • Agent Timeline View: I also explained that while you can only add 12 metrics to display, I advised them to be thoughtful in the order in which you select them. I found that the order in which you click on the metrics to display is how they actually display from left to right.

    • I also advise each person I work with to save their Views so they do not need to recreate them later.
         a. I personally created a saved view called 00. My Interactions since I frequently search for interactions and the default Interactions view only displays  a handful of columns and I need much more. I added in things like ANI, DNIS, Conversation ID, First Queue, Queue, Skill, Flow, Transfer, Abandon, and Voicemail
    • Interaction View: When searching for ACD Voicemail, by the Callback media type in the Interactions View, I add the voicemail column to identify which interactions are actually ACD Voicemail. Similar when searching the Message Media Type, you need to add the Message Type column to identify which are SMS and which are web messages

    • Another tip is when saving views, enumerate the important ones so they populate at the top of your saved views list so they are easily .


    ------------------------------
    Nicki Dehn
    Senior Cloud Partner
    AAA Club Alliance
    ------------------------------


  • 31.  RE: Reporting & Analytics Tips and Tricks Contest

    Posted 27 days ago

    True Reporting on Callbacks

    We all are aware that Voice Media Type includes voice, callback, and voicemail types.  Also, you cannot report on callbacks and voice types at the same time.  Additionally, Callback type includes queue callbacks and outbound campaign callbacks.  So, how do you report on just callbacks?

    I suggest using the Voice type and Filter Direction to Outbound and Initial Direction to Inbound.  Now you will see in the Performance tab, only queue callbacks and the queue Interactions tab will be filtered for just those interactions with a queue callback.  

    Simple solution for a long-desired outcome. 

    Let me know your method.  


    ------------------------------
    Robert Wakefield-Carl
    ttec Digital
    Sr. Director - Innovation Architects
    Robert.WC@ttecdigital.com
    https://www.ttecDigital.com
    https://RobertWC.Blogspot.com
    ------------------------------


  • 32.  RE: Reporting & Analytics Tips and Tricks Contest

    Posted 26 days ago

    When using decision nodes to track the path a call takes through the flow, we can utilize flow milestones with appropriately named identifiers and outcomes at each node. This approach allows us to distinguish between different paths and capture success or failure outcomes. By analyzing these milestones, we can determine how many calls followed successful paths versus those that resulted in failure under Flow performace


    ------------------------------
    Deepa Subramanyam
    Senior Technology Specialist
    ------------------------------


  • 33.  RE: Reporting & Analytics Tips and Tricks Contest

    Posted 26 days ago

    Hii,

    As Client always needs to download the report manually, We can set the Schedule to easy the work and automate the system for MIS.

    Schedule Daily or Weekly Exports (Automatic Reports)


    1.From a Performance view, click Export  and in the Export pane, click Schedule.

    2.Set it to run daily or weekly

    3.Add Emails ID's to receive Scheduled Emails or download automatically

    4.To see the Scheduled Exports view, click Performance > Workspace > Others > Scheduled Exports.

    5.You can modify, delete, enable or disable the Schedule from scheduled Exports View

    No need to log in every day to download reports manually.


    ------------------------------
    Santosh Midrap
    ------------------------------


  • 34.  RE: Reporting & Analytics Tips and Tricks Contest

    Posted 26 days ago

    One tip that's really helped me is customizing Performance Views using filters and saved layouts for different teams. By tailoring views to specific roles (like supervisors vs. agents), we've reduced time spent digging through irrelevant data and improved decision-making speed.

    Another helpful trick: scheduling Dashboard exports to be emailed automatically. It keeps key stakeholders in the loop without requiring them to log in daily - especially useful for leadership teams.

    Both of these have streamlined our reporting process and made analytics more actionable across departments.


    ------------------------------
    Gaurav Kumar
    ------------------------------


  • 35.  RE: Reporting & Analytics Tips and Tricks Contest

    Posted 26 days ago

    As an Auditor, one of my frequent tasks is to verify whether access provisioning is done with the right approvals. Instead of reaching out to the application owners every time, which can delay the process, I've created an approvals list report for each application directly in ServiceNow Reports Home, using the relevant application database.


    This helps me to quickly validate approvals during testing and walkthroughs, saving time and increasing audit efficiency. It's especially helpful during high-volume testing cycles and also ensures that our evidence remains consistent and traceable.
    Happy to share how I set up these reports.


    ------------------------------
    Sowjanya Ponnaluru
    Senior Analyst - SOX Compliance
    ------------------------------


  • 36.  RE: Reporting & Analytics Tips and Tricks Contest

    Posted 22 days ago

    I get asked all the time to report on CSAT scores and what interaction they come from, etc. It's a really straightforward process but one that doesn't get utilized by others a lot.

    1. Performance, Workspace
    2. Interactions
    3. Filter by clicking "Show only interactions with survey data", and then choose your desired Range. I want to see every survey that didn't pass the benchmark.
    4. Click the "+" and scroll to the bottom to choose "Survey Score" so you can see what the score is up front.

    Now you can review those calls that didn't pass the CSAT mark and coach accordingly.


    ------------------------------
    Amy Sessions
    Division Manager, Utility Customer Service
    City of Clearwater
    ------------------------------


  • 37.  RE: Reporting & Analytics Tips and Tricks Contest

    Posted 17 days ago

    One tip that's made a huge impact for us is using custom Alert Rules to notify supervisors when key thresholds are breached, helping us manage agent performance and customer wait times more proactively.

    🔍 What we did:
    We created alert rules to notify supervisors when agents are not responding, stay too long in ACW, or return late from breaks. we also set up queue alerts for when wait times get too high.You'll receive notifications similar to the one shown below:

    🎯 How we did it:

    • Added all team members into a Work Team.

    • Created targeted alerts tied to this team using specific time conditions or queue thresholds.

    • Set the notification delivery via in-app to the supervisors, ensuring they can step in immediately.


    ------------------------------
    Princy Paul
    Contact Centre Team Leader
    ------------------------------


  • 38.  RE: Reporting & Analytics Tips and Tricks Contest

    Posted 15 days ago

    Hi, Princy! This is great that you managed to make alerts work for your company! Just curious how big is your org - how many agents/work teams do you have? :)


    ------------------------------
    Ekaterina (Kate) Kononova
    Product Development | Data, Analytics & Quality Management
    Sweden
    ------------------------------


  • 39.  RE: Reporting & Analytics Tips and Tricks Contest

    Posted 15 days ago

    Hi Kate,

    Thank you! 😊 

    We're a mid-sized local government contact centre with around 20-25 agents. We operate 24/7 and are spread across different workgroups - handling calls, emails, messages, and monitor alerts. Our team rotates across channels, so having alerts in Genesys in place really helps us stay on top of high-priority or time-sensitive queues.


    ------------------------------
    Princy Paul
    Contact Centre Team Leader
    ------------------------------


  • 40.  RE: Reporting & Analytics Tips and Tricks Contest

    Posted 15 days ago

    I guessed right then=) Thank you! We explored this feature, but we have 12000 users in 30 countries :D 


    ------------------------------
    Ekaterina (Kate) Kononova
    Product Development | Data, Analytics & Quality Management
    Sweden
    ------------------------------


  • 41.  RE: Reporting & Analytics Tips and Tricks Contest

    Posted 15 days ago

    1.From a Performance view, click Export  and in the Export pane, click Schedule.

    2.Set it to run daily or weekly

    3.Add Emails ID's to receive Scheduled Emails or download automatically

    4.To see the Scheduled Exports view, click Performance > Workspace > Others > Scheduled Exports.

    5.You can modify, delete, enable or disable the Schedule from scheduled Exports View

    No need to log in every day to download reports manually.


    ------------------------------
    Dharani Reddy
    Senior Executive Consultant
    ------------------------------


  • 42.  RE: Reporting & Analytics Tips and Tricks Contest

    Posted 15 days ago

    Whenever a standard report is not available in Genesys, we have found that Excel or Power BI Desktop, using Power Query M language, is excellent for reporting on data returned by the Genesys API.

    For example, we used Excel to report on all surveys completed over the week, including details by agent and queue, as well as analyzing free-text feedback left by customers. We also integrated a Gen AI model to analyze the sentiment of the feedback.


    ------------------------------
    Yuezhong Zhang
    Software Solution Architect
    ------------------------------


  • 43.  RE: Reporting & Analytics Tips and Tricks Contest

    Posted 15 days ago
    Edited by suyog gupta 15 days ago

    Hi @Yuezhong Zhang Thanks for sharing your experience with reporting in Power BI-really interesting! We're currently in the process of extracting data via APIs and loading it into our data warehouse, with plans to build our reports in Power BI as well. I'd love the opportunity to connect and learn from your approach-how you implemented it, the effort involved, and what we might consider doing differently. Any insights or lessons you're willing to share would be greatly appreciated.  

    Especially the survey part. 


    ------------------------------


  • 44.  RE: Reporting & Analytics Tips and Tricks Contest

    Posted 14 days ago
    Edited by Lucas Woodward 14 days ago
    On the topic of using Genesys Cloud's Platform API to create reports, I love Genesys' API-first approach that allows this.
    I created a tool at work that pulled down conversation data on a schedule to report on specific scenarios in conversations e.g. how many conversations that involved an agent started with the customer speaking to chatbot X.
     
    Recently I've been experimenting with connecting AI to Genesys's APIs to analyse data. To achieve this I created an MCP Server for Genesys Cloud. You can then use this with Claude (an AI provider) to ask it to:
     
    • Create a graph showing sentiment trend of queue X over the past 7 days.
    • Find the conversation with the lowest sentiment yesterday on queue X, and analyse its transcript to explain why the sentiment was so low. Also advise on how the agent could have prevented it.
    • etc

    There's a screenshot on a recent LinkedIn post showing what it looks like.


    ------------------------------
    Lucas Woodward
    OVO Energy Ltd

    https://www.linkedin.com/in/lucas-woodward-the-dev
    ------------------------------


  • 45.  RE: Reporting & Analytics Tips and Tricks Contest

    Posted 14 days ago

    I M in


    ------------------------------
    pardha saladi
    ------------------------------


  • 46.  RE: Reporting & Analytics Tips and Tricks Contest

    Posted 13 days ago

    Only a few days left to enter, we have had some great submissions so far.  Still a chance for a few more entries! 


    ------------------------------
    Sam Jillard
    Online Community Manager/Moderator
    Genesys - Employees
    ------------------------------


  • 47.  RE: Reporting & Analytics Tips and Tricks Contest

    Posted 13 days ago
    Edited by Matt Lawson 7 days ago

    Hello everyone
    Although it may seem simple, it's important to me. To filter calls that are billable if you pay per answer, you shouldn't use the general abandoned parameter (the abandonment could be done in a survey, for example, and the service could be correct) and use the handling parameter, since with the total call duration you could include time in the IVR where the agent is idle.

    Regards


    ------------------------------
    Soraya Granda Segovia


  • 48.  RE: Reporting & Analytics Tips and Tricks Contest
    Best Answer

    Posted 11 days ago

    Maximizing Customer Insights with the Queue Topics Dashboard

    One of the most underrated yet powerful features in Genesys Cloud is the Queue Topics Dashboard, which provides speech and text analytics topic data tied to specific queues. This dashboard gives you deep insight into what your customers are really talking about without relying solely on agent-selected wrap-up codes.

    To access the dashboard:

    1. Go to Performance -> Workspace

    2. Search for "Queue Topics" under Speech and Text Analytics

    3. Select the queue you want to analyze

    This tool has proven incredibly valuable to our client. They were pleasantly surprised it existed and have since integrated it into their regular reporting and analysis. It's now a key driver for enhancing their CX strategy, identifying pain points, and continuously improving customer experience.


    ------------------------------
    Joseph Tan
    x
    ------------------------------


  • 49.  RE: Reporting & Analytics Tips and Tricks Contest

    Posted 11 days ago
    Edited by Mike Morris 11 days ago

    Interaction reporting by Flow was great for me. 

    1. Open up Interaction reports
    2. In the filter select the flow you want, so for us we picked an absence line flow
    3. press save and then every time you run this you can streamline the intearactions to just agents or customers on that set flow. 

    For me this was really useful to help monitor our agents ringing in on our absence line to report that they would not be in for the day. 


    ------------------------------
    Mike Morris
    Product Manager - BCD
    ------------------------------


  • 50.  RE: Reporting & Analytics Tips and Tricks Contest

    Posted 8 days ago

    Thanks for all the great submissions, we will now review the entries and choose a winner which will be announced shortly.


    ------------------------------
    Sam Jillard
    Online Community Manager/Moderator
    Genesys - Employees
    ------------------------------


  • 51.  RE: Reporting & Analytics Tips and Tricks Contest

    Posted 7 days ago
    Edited by Matt Lawson 7 days ago

    Hello Everyone

    We're thrilled to announce the winner of our Reporting & Analytics Tips and Tricks Contest - a celebration of innovation, creativity, and community knowledge sharing.

    Congratulations to @Joseph Tan.

    Joseph impressed the judging panel (Reporting & Analytics Product Managers and Community Team) with his insightful and practical tip, highlighting a powerful yet often underutilized feature in Genesys Cloud:

    Winning Entry: Maximizing Customer Insights with the Queue Topics Dashboard

    In his tip, Joseph demonstrates how the Queue Topics Dashboard can unlock deep customer insights by leveraging speech and text analytics tied to specific queues. Instead of relying solely on agent-selected wrap-up codes, this feature allows users to:

    • Discover what customers are truly talking about
    • Identify pain points more effectively
    • Make data-driven improvements to the customer experience strategy

    How to Access the Queue Topics Dashboard:

    1. Navigate to Performance > Workspace
    2. Search for "Queue Topics" under Speech and Text Analytics
    3. Select the relevant queue to begin your analysis

    Joseph shared that one of his clients was surprised to discover this functionality and has since made it a core part of their regular reporting and CX optimization efforts. It's now a key driver in enhancing their overall strategy.


    Thank You to All Participants

    We received many valuable and creative submissions that showcased the depth of knowledge across our community. Your contributions are what make the Reporting and Analytics Community a vibrant and collaborative space.

    If you are ready for your next community contest, we have an incredible Midyear Challenge that just launched and there is the chance to win multiple prizes. Get a jumpstart on the competition! 

    Keep the insights coming and happy reporting!


    ------------------------------
    Sam Jillard
    Online Community Manager/Moderator
    Genesys - Employees
    ------------------------------


  • 52.  RE: Reporting & Analytics Tips and Tricks Contest

    Posted 2 days ago

    Hi @Samuel Jillard,

    Thank you so much for selecting my entry as the winner! I just wanted to follow up regarding the prize or next steps. Looking forward to hearing from you and thanks again for the opportunity to share and learn with our community.


    ------------------------------
    Joseph Tan
    x
    ------------------------------


  • 53.  RE: Reporting & Analytics Tips and Tricks Contest

    Posted 15 hours ago

    Hi Joseph,

    Thank you for being part of the community. You should now have received an email about this. I hope you pick a great prize :D


    ------------------------------
    Sam Jillard
    Online Community Manager/Moderator
    Genesys - Employees
    ------------------------------


Need Help finding something?

Check out the Genesys Knowledge Network - your all-in-one access point for Genesys resources